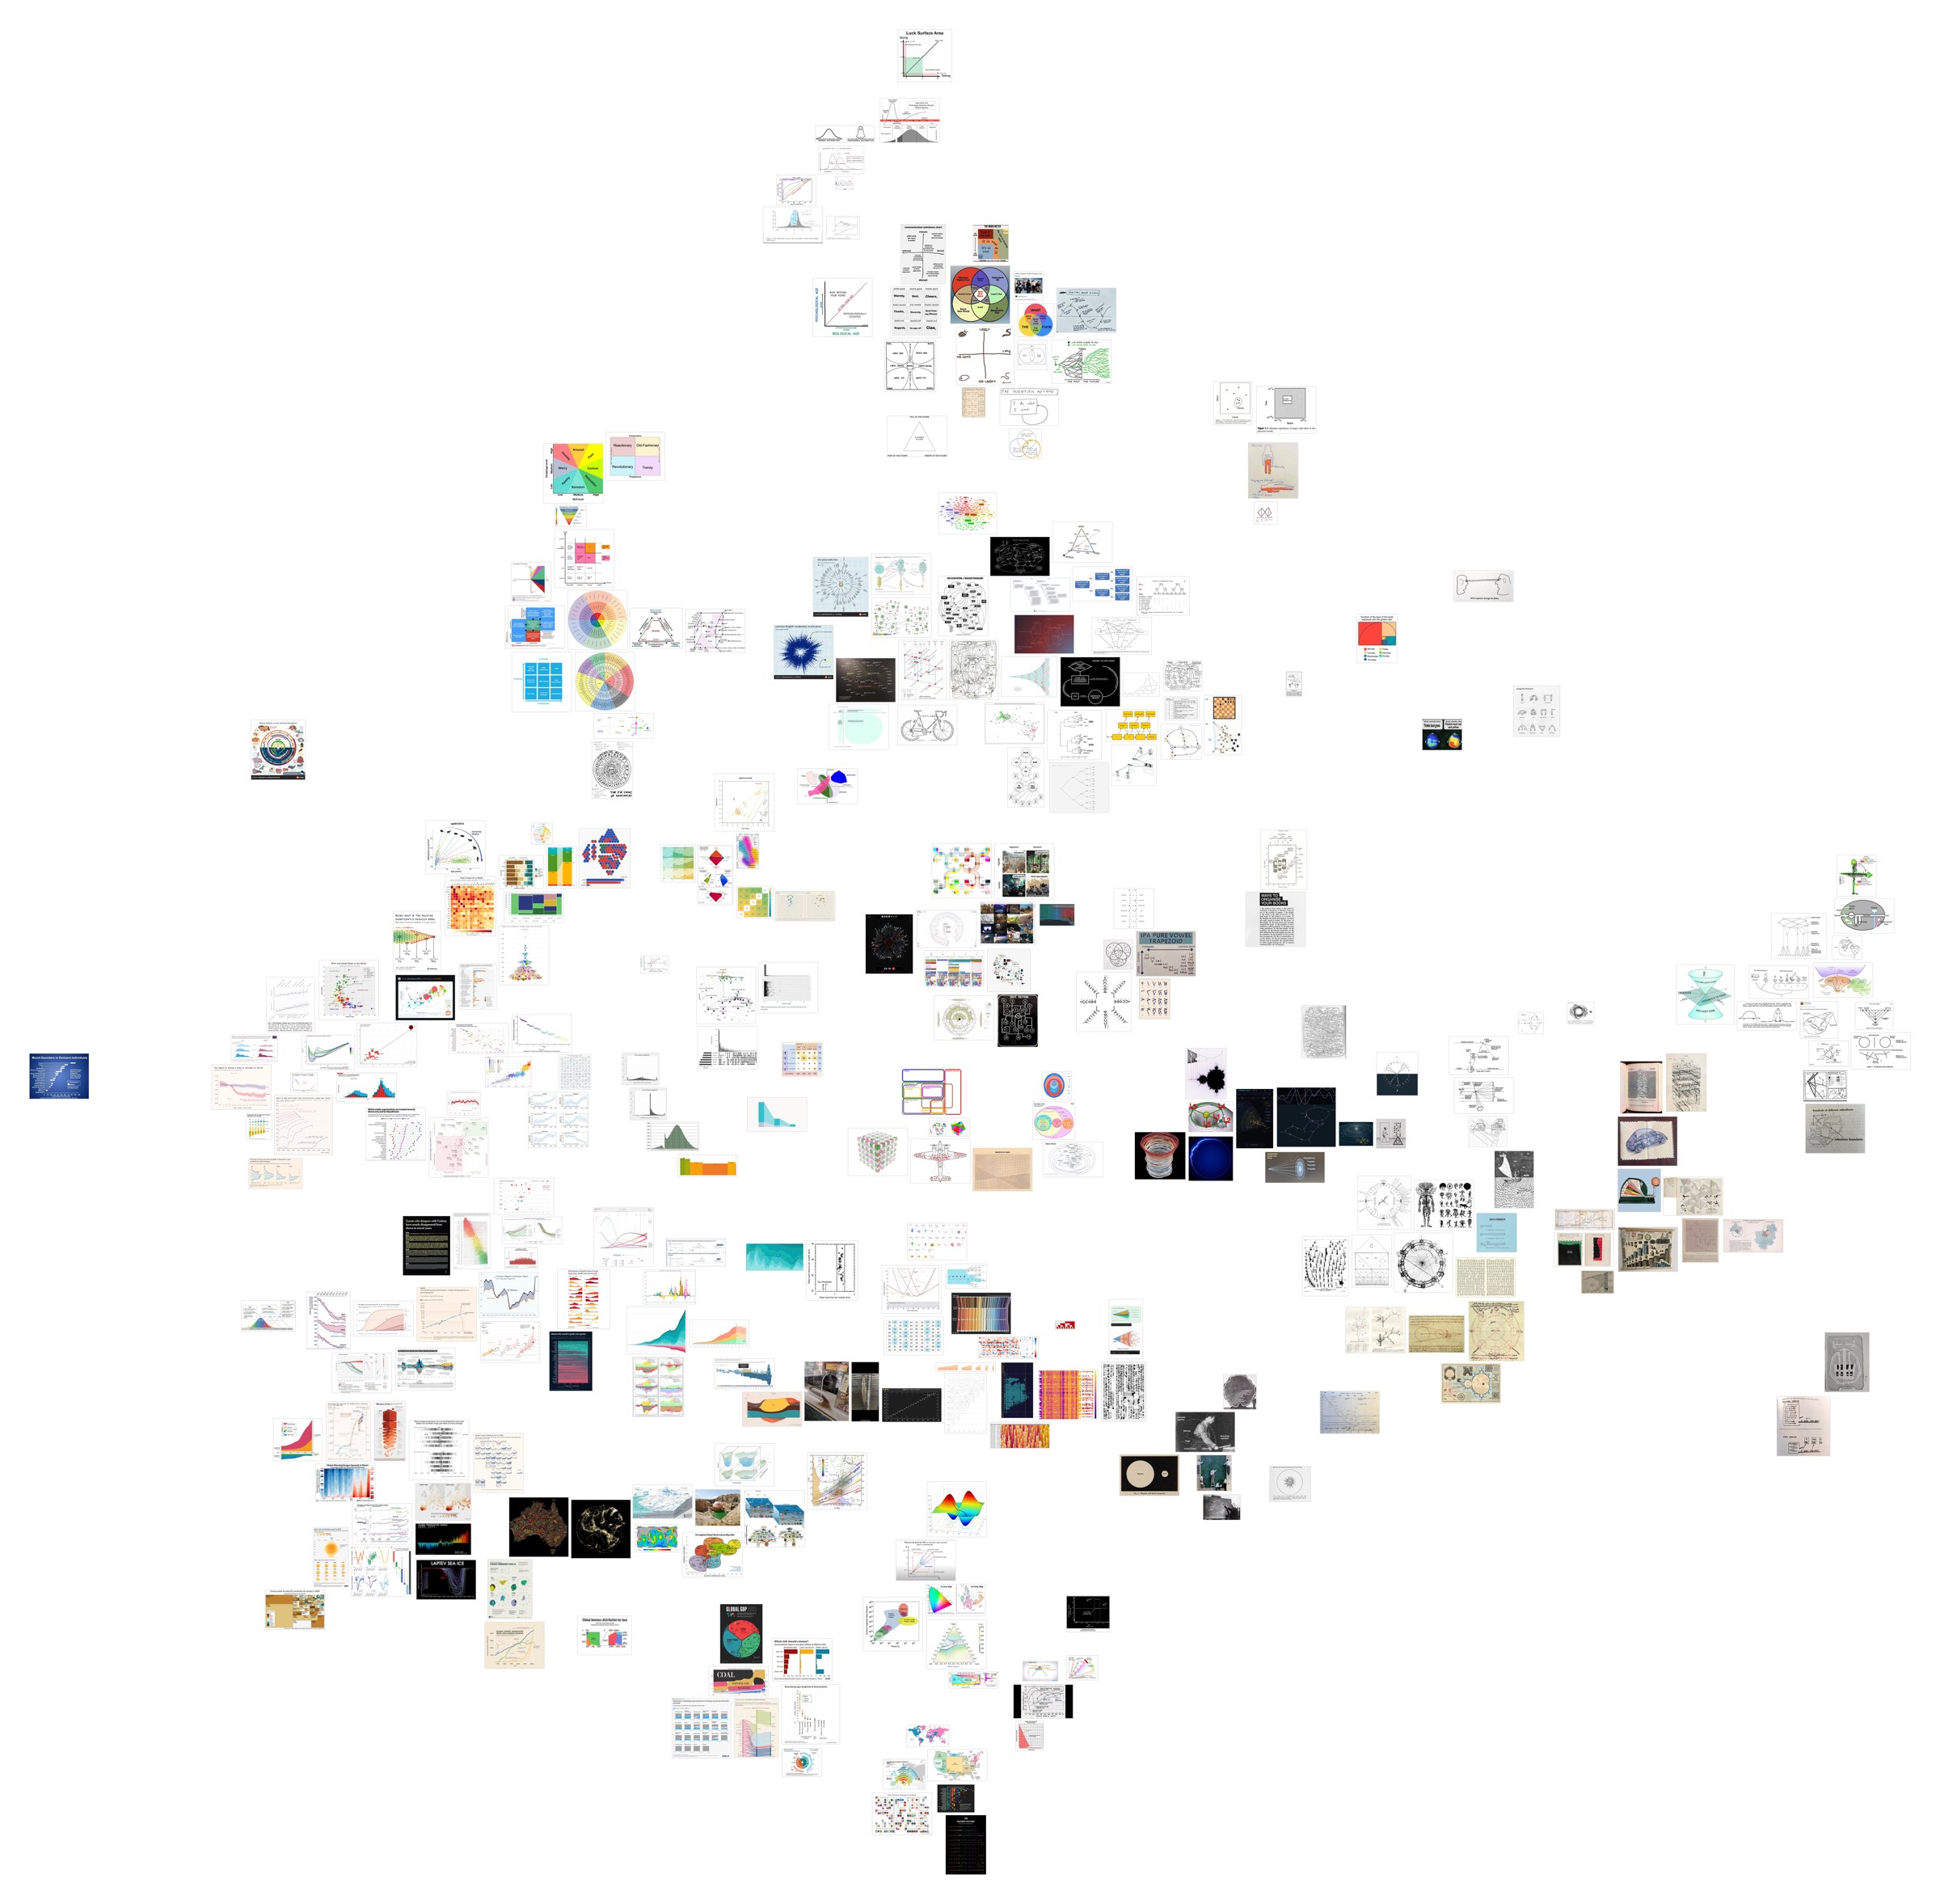
I like checkin’ out charts. A vision model embeds each image, UMAP and HDBSCAN group them into clusters, and the whole thing is cut into a tile pyramid so it can be explored like a map. Searchable by text and tags.
I like checkin’ out charts. A vision model embeds each image, UMAP and HDBSCAN group them into clusters, and the whole thing is cut into a tile pyramid so it can be explored like a map. Searchable by text and tags.